The data that the algorithm has to consume is very extensive and has a lot of inconsistencies. Understanding the data we are given has been the largest focus of our research, and took a considerable amount of time. Next, we looked into efficient ways of storing everything and technologies that we will use for the back-end and the API. Finally, we analyzed various algorithms and compared their efficiency.
Data
Most of the data can be broken down into 4 main parts: The Schedule, Diagrams, Trust Reports and GPS Reports. There are also some additional parts like geographical locations for all tiploc codes and tables that map the unit codes into a particular gps_car_id (more on this later), however they are static and should rarely change.
We will try to outline some of the data, without going into too many details.
Schedule
The Schedule is used to outline where a particular train should be at a point in time. For example it might state that the service with headcode 5A21 might depart A at 9am.
To understand the data, we will discuss the main column headings:
- Headcode - This is a code that is used to identify a particular service. An example is 5A07. However it also contains other useful information:
- The first character identifies the kind of train it is:
- 0 - Locomotive
- 1 - Express Passenger
- 2 - Other Train
- 3 - Expedited Empty Coaching Stock
- 5 - ECS
- The second character identifies roughly where the service is going. Some examples:
- A - London
- N - Newcastle
- E - Scotland to Eastern Region
- S - Western Region
- D - Leeds
- The first character identifies the kind of train it is:
- Time - Outlines when this event should happen.
- Event type - Can be departure (D), arrival (A) or a pass through the station (P).
- Tiploc - a code used to identify a location (station or junction).
- CIF_UID - Identifies a particular service, but unlike Headcode, it is unique, on a given day.
- Schedule_days_run - A 7 bit field that represent the days of the week the service is run
- Line - If a service can run through more than 1 line, this field will specify which
- Pathing_allowance - The time taken to cross a junction
The main part of the Schedule is usually set for several months. However a new copy will be available at the start of each day to make sure that it includes any last-minute changes. The Schedule can be accessed on the Netowork Rail Datafeeds website through the STOMP protocol.
Additional information can be found here.
Diagrams
After the Schedule has been created, we still need to know which Rolling Stock will run which Service. Hence, every Rolling Stock has a Diagram that outlines the services it will run on a particular day.
Some of the main column headings are:
In addition to using the Diagrams, we will also be using the Genius Allocation, which is a very similar format to the Diagram. However, instead of having one Diagram for every Rolling Stock, we only have one Genius Allocation per day. The file contains all of the services that will be run that day, the origin location and which Rolling Stock is supposed to run the service.
Due to the fact that the Diagrams are considered as sensitive information, we are not able to show any.
Trust Reports
The Trust Reports, unlike the Schedule and the Diagrams, are real-time. Every track is divided into berths. At the border of 2 berths, there is a sensor, which creates a report every time a service passes. These reports are called Trust Reports and they provide us real-time information on the services. Some of the most important column headings are:
- Headcode - See Schedule
- Tiploc - See Schedule
- Location Sequence - Identifies which stop in the service sequence
- Time
- Auto_Expected - If an automatic report was expected from a signal If this is false, the report is often unreliable
- Stanox - The location code that the operational systems use
- TOC_ID - The Train Operating Company’s numerical ID
Essentially, the Trust Reports help us to identify the location of a particular Service, but it does not tell us anything about the Rolling Stock.
One problem with TRUST reports is their delay. A report can be off by several minutes. Additionally, some reports are still done manually, so there can also be some false data in the system.
We can get the Trust Reports using the STOMP Protocol through the Network Rail Datafeeds website. Additional information can be found on this website.
GPS Reports
The GPS reports are used to find the location of the Rolling Stock. We mainly use the GPS and Trust Reports to find which Rolling Stock is running which service. The essential column headings are:
- Device - The device is a unique identifier for a particular Rolling Stock, like the unit. We have a different data source to convert between both.
- Event Type - See Schedule
- Tiploc - See Schedule
- Easting and Northing - To define the location
- Speed of the Rolling Stock
- Time
There are a couple of examples where GPS does not work well. One of them is in tunnels because the satellites are near the horizon. Or another example is in stations where there is a lot of steelwork. Any of the above, or even various other situations will result in offsets.
The GPS data is considered sensitive information therefore we cannot display any examples.
Visualisations
Node Feeds (see demo)
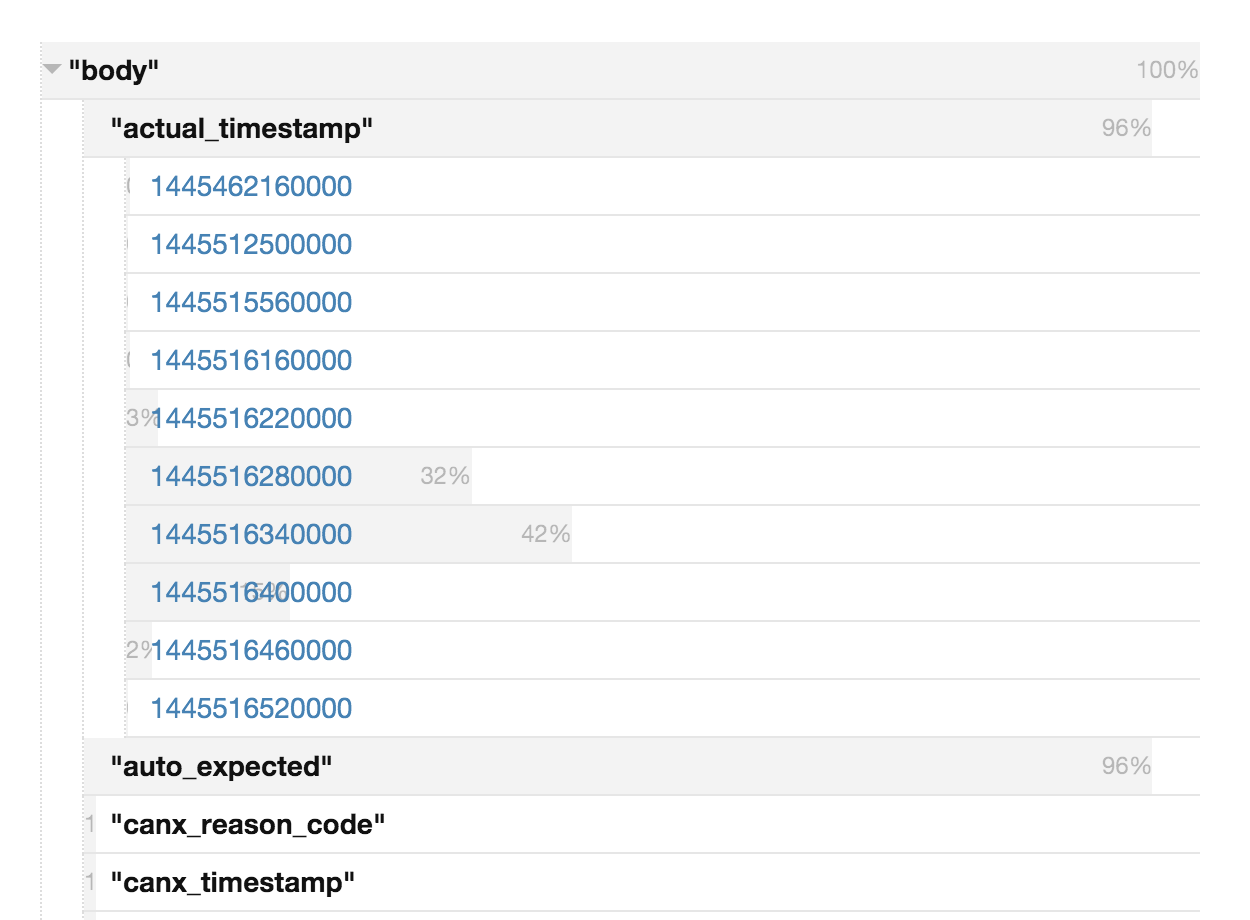
To understand the data, we started with a simple Node.js application that consumed “train movements” messages from the Network Rail data feeds, which is realtime data of the locations of all the trains in the UK.
The application stores every field that occurs, all the values it can have and how often they occur. It enabled us to roughly guess what the fields and values mean, which we found hard initially because of the lack of documentation, and it was also helpful in our meeting with the client, where he could go through explaining what each field and value means.
TRUST & GPS event matching (see demo)
Understanding what the column headings mean was one part however actually understanding what the data means is another. We started going through the data by hand however this seemed to be inefficient. Therefore, we started researching visualisation technologies, like D3, to get a clear view on everything and identify common inconsistencies that our algorithm needs to be able to handle.
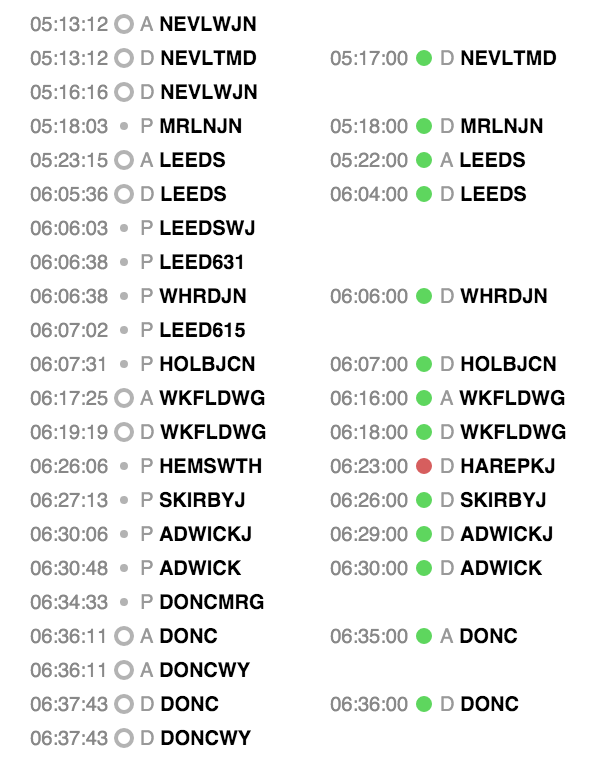
For this visualisation, we used D3 and we kept the UI relatively simple. In the top left corner, you can choose which Rolling Stock you want to analyze by selecting the appropriate gps_car_id. Then we display all of the GPS Reports of that Rolling Stock in the left column, ordered by time. We also state the type of the report and the Tiploc code of where the report was generated.
Next, we use the Genius Allocations to find all of the Services that that particular Rolling Stock was planned to run. An algorithm goes through all the Trust Reports of these services and tries to match them to the correct GPS Report. We first check if the GPS Report is within a given time limit. Then we check if the event has the same Tiploc code and the same event type. If the algorithm finds a matching GPS Report for a given Trust Report, we display the Trust Report next to the appropriate GPS Report with a green circle. If no match if found, we still display the event but with a red circle.
Now we can easily see if a Rolling Stock actually ran all of the services it was supposed to run, by simply looking at the amount and order of red and green circles.
Discoveries
Trains runnning close to each other
It sometimes happens that 2 services are travelling very close to each other. The current algorithm has difficulties distinguishing which rolling stock ran which service. Hence, in the next iteration of the algorithm, we will track the rolling stock long-term and analyze the headcode of the service to know which general direction it is going.
Trains running in a loop
Another issue we came across is trains running in a circle, where we don’t know the overall direction they are travelling in.
Service run by multiple rolling stock
Sometimes 2 Rolling Stock seem to run the same service (and they do) but at a certain point they split. Or the other way is possible as well, when 2 Rolling Stock join to run a service together.
Train travelling behaviours
Another important fact is that different types of trains tend to behave differently. For instance an Empty Coaching Stock is very unpredictable because they are not considered as important as Passenger Trains. They are also more likely to be affected by external factors therefore the algorithm will assign a higher probability of an Empty Coaching Stock changing than for example a Passenger Train. Additionally, some companies may turn the train around to manage crowds or to make sure that the first class carriage is facing the correct way, which may mean travelling to the nearest track loop.
Inaccurate reports

The GPS data can sometimes repeatedly report arrivals and departures of the same train, at the same station, even though the train itself is stationary. This is because the GPS data divides the world up into several areas. If the train is first outside the area according to the GPS and then inside, a report will be generated where it arrives and the other way around. So if a Rolling Stock is parked near the border of an area for several hours, various reports might be generated where the train keeps arriving and departing from the same station.