Prototype
In the first iteration of our prototype, we implemented a simple algorithm. It matched the Trust Reports to the GPS Reports by comparing the Tiploc codes and Event Types within a certain time limit. Next, the algorithm checked if the Unit was supposed to run that service and gave a preference to those Units. Finally, we calculated how the percentage of how likely a given Rolling Stock ran the services.
Algorithms
The first algorithm we used was a simple statistical one, and it was used in last year’s project. It calculated how likely a Service was run by a particular Rolling Stock by calculating how many Trust Reports match with a GPS Report. Next, we combined that algorithm with our visualisation to see how accurate it was. After careful evaluation, we concluded that it was not accurate enough and therefore we had to move on to a more complex version.
Statistical Algorithm (see demo)
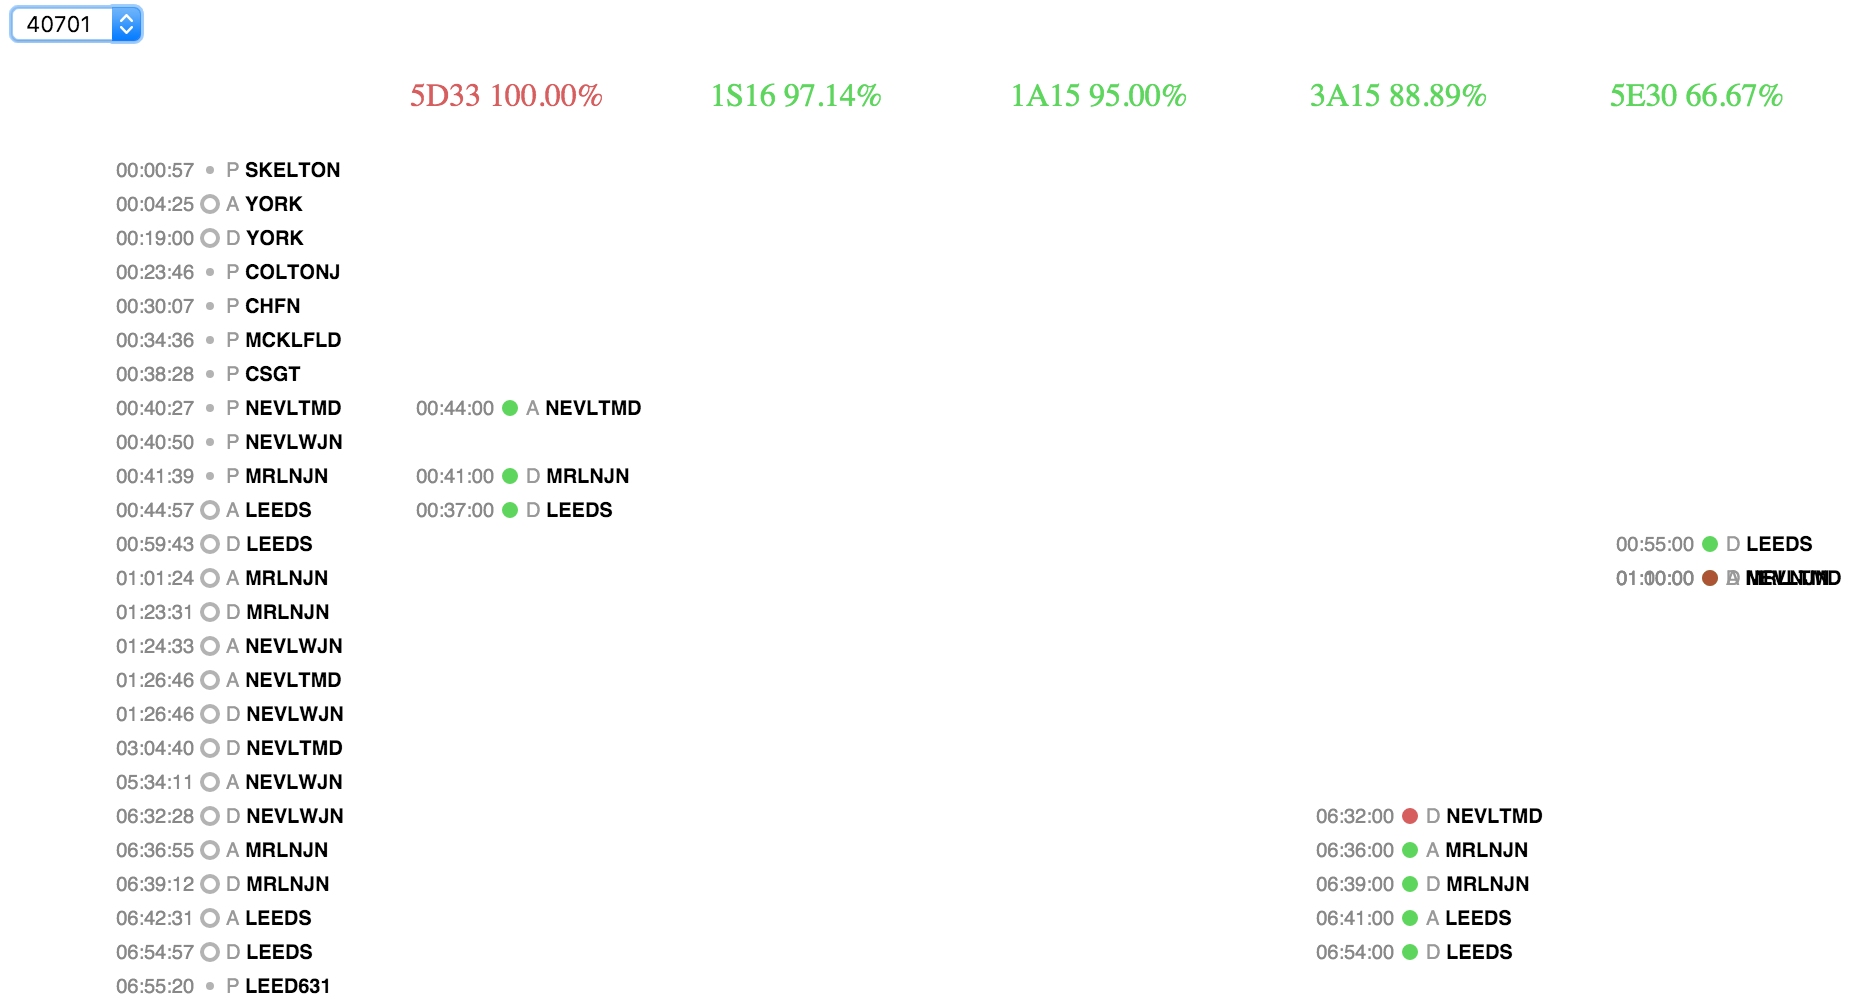
Like the first visualisation, the statistical algorithm uses D3.js in order to display the results. The interface looks similar as well. In the top left corner, you can select the gps_car_id of the Rolling Stock you want to analyze. Then the algorithm lists all of the GPS Reports in the first column.
Next, for all services, we compare all of the Trust Reports to the GPS Reports. Using that data, we can calculate how many Trust Reports match with a GPS Report and calculate the probability of a Rolling Stock running the service.
Finally, we display all of the Services with a high enough probability. Every column, which represents a service, lists all of the Trust events and again, a green circle is shown if the Reports match and a red circle if no match is found.
API Endpoints
Our prototype uses two main API endpoints to serve data, one for GPS and the other for TRUST data. These are used to fuel the data visualisations. They are located at /events/gps.json and /events/trust.json
Infrastructure
In the beginning of the project, we researched various technologies and analyzed them to determine which ones were the most appropriate. Below is the full list of all the technologies we have used and why:
PostgreSQL
Why a Database?
We receive data in various different sources (JSON, CSV, text files). Therefore querying and analyzing data is not always easy in their original form. So the team decided to have a database, to store all of the data.
Why an SQL Database?
Since some of the data is very inconsistent and is missing several values quite often, we first considered a NoSQL database since it would make storing the data very easy. However, we noticed some relations between several data sources that we could express very naturally in an SQL database. Additionally, our algorithm will be querying and joining the data very often. Therefore the advantages of using an SQL database outweighed the disadvantages.
Why PostgreSQL?
Now that we have decided to use an SQL database, we still had to choose from a wide range of options. After some research we found that PostgreSQL would be the most appropriate for several reasons:
- PostgreSQL is easily extensible. We learned that the PostGIS extension is very capable and popular when it comes to querying and storing location data in a database, whereas MySQL is much more limited.
- PostgreSQL is widely used, which means that there is a strong community that can offer support.
- It’s open-source.
Flask
We wanted to use a object-oriented language that everyone in the team was already comfortable with. Thus essentially we had to choose between Python and Java. However Python seemed more appropriate because it is dynamically typed, it also is a lot more concise and therefore also easier to read and debug and then finally, Python is a very compact and powerful language. Therefore, we decided on using Python for the backend and a web application for the frontend. But in order to use Python to create a web application, we needed a web framework.
Everyone wanted a small, minimal framework with a very short learning curve so we could immediately start developing. Additionally, the framework had to be extensible so we could use it with PostgreSQL and any other technologies that we might decide on later. So since Flask checked all of these requirements, we decided to use it, together with various dependencies.
SQLAlchemy and psycopg2
SQLAlchemy is one of the most used tools to use SQL inside a Python application. Together with psycopg2, a Python adapter for PostgreSQL, we can use it to access our database. We mainly chose both tools because they are very easy to install through pip and to integrate with Flask. Additionally, there are a lot of examples, which use the same setup.
Virtual Environment
A Virtual Environment is a tool to keep all of the Python dependencies in the same place. In order to do so, virtualenv creates a folder with all of the necessary executable to use the packages. Therefore all of the team members do not need to worry about which version of a dependency they are using. This makes the development process a lot easier because we spend less time trying to configure each other’s machines.
D3.js
D3.js is a JavaScript library for manipulating HTML DOM elements based on data. There are a lot of JavaScript libraries for visualisations, but D3.js is one of the most flexible ones. Even though it might not be easy to learn, the library will allow us to customize everything in the visualisation. Additionally, there is a lot of documentation and examples available online that helped us to learn.
So the overall infrastructure of our application looks like:
Heroku
Heroku is a could-based application platform that aims to make building, deploying and scaling a lot easier. Therefore we would not have to worry about deployment because it abstracts away a lot of the SysAdmin work. Thus we can focus on the actual algorithm and prototype. Another reason why we use Heroku is because it allows us to automate a large part of the deployment process. We simply have to push our code to the server and then deployment is automated from there on. In general, Heroku seemed to have a lot of advantages over traditional deployment on an amazon EC2 instance.
In order to deploy, we only need to run 3 commands.
heroku login
In your git repo, add git remote to Heroku
heroku git:remote -a atos-service
Pushing to production
git push heroku master
Building the application
There are a couple of tools you need in order to build, run and deploy the application:
- Python
- pip - A Python Package Manager to share and reuse code
- Flask - The Python web framework
- psycopg2 - A Python adapter for PostgreSQL
- SQLAlchemy - Tool to write SQL within a python application
- virtualenv - Manages all of your Python dependencies
- Node Package Manager (npm) - A package manager that can be used by JavaScript developers to share and reuse code
- JavaScript Package Manager (jspm) - A second JavaScript package manager, which is required to use ES6
- d3 - JavaScript library for manipulating HTML DOM elements based on data
- git - Version Control Software
- PostgreSQL - SQL Database
- Heroku - Cloud-Application Platform to deploy the application
A description of how to download, install and use these tools can be found on the project’s readme.
UML
Database Model
Application Model
User Interface
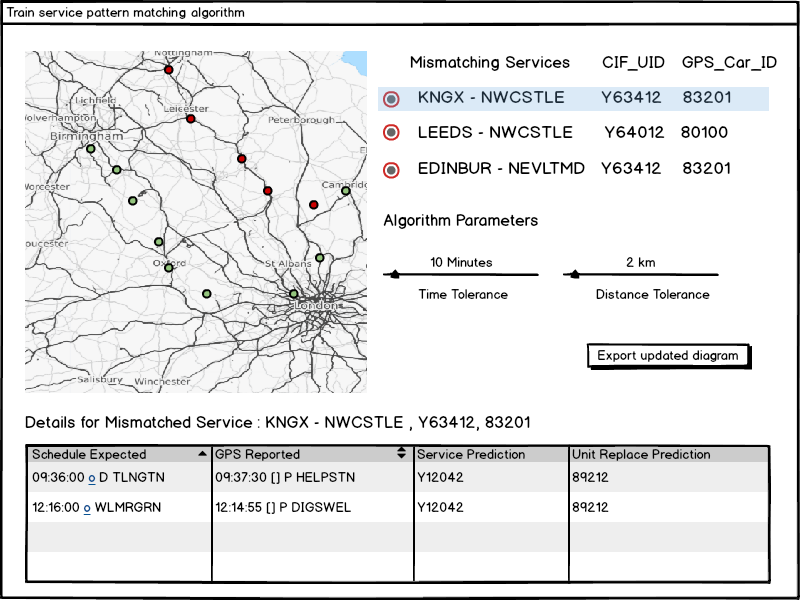
The user interface of our application contains a map that visualises all of the reported data points and colours indicate whether the algorithm has found a match. The section to the right would list all of the units (of rolling stock) that have been identified as not matching their services. The algorithm parameter option allows the user to change the matching algorithms parameters like time and distance tolerance between Tiplocs. The user can select a particular mismatched service and the system will display details of the mismatched reports and it’s predictions.
A rough UI wireframe is shown below:
HCI Considerations
As the client did not have any explicit usability requirements (as the project itself is an algorithm rather than an application), we explored a few UI styles that may help make interpreting the output of the algorithm easier.
The map is a solution to a common problem that we have been experiencing with train services data. It helps the user see the whole picture, as to where the GPS or TRUST reports happened, and what the algorithm has decided. In odd situations where trains loop around the user is also able to see it graphically as opposed to a string of text that doesn’t tell you much.
The right section displays the most important information that the client needs in this project, which is which services aren’t being run by the planned rolling stock. The details pane below will initially be hidden, but once the user selects a particular mismatched service, the details of what the algorithm has found is displayed.
The button that is used to export the corrected diagrams is also easily accessible and the only button on the page to help emphasise the most important feature.
User Testing
We will provide a group of users with background and context and ask them to perform common tasks on the test application and then observe their behaviour. After this we will have a brief interview with them to gather feedback on specific points of the application.
Some open questions we would ask:
- How easy was it trying to find the new corrected diagrams?
- Do you feel like you could easily find mismatched services?
- What do you feel about the representation of data points on the map?
- Are you able to tell what is happening to the services as a whole at a particular time?
As our main target audience for this algorithm are people working in the train industry, our focus would be to test on people in this audience, the most important one being our client.
Testing Strategies
We have researched techniques and tools for testing which we plan to use once we start developing and experimenting with more complex algorithms. Our plan is to automate testing as much as possible, by connecting it to our version control system and testing on every change, so we detect errors early.
We plan to use Travis, which is popular, free and has easy integration with Github for continuous integration.
Below are some of our test plans for Term 2:
Unit Tests
We will have a test suite written for the main algorithm itself which includes:
- The matching of station names and the geographical locations
- The matching of the time within x minutes
- Matching of event type
- Matching headcodes with specific train types and rough destinations
- Matching services to rolling stock with Genius Allocations
Functional Tests
Aside from the algorithm itself, we plan on using Selenium to automatically test the web application.
Once we do get the dataset that outlines what actually happened,that was generated manually by the TOC’s, for the sample data that we were given, we can also write tests that can take multiple data streams and results from historic data to test the accuracy of the algorithm.